Executive Financial & Revenue Intelligence: Power BI Dashboard

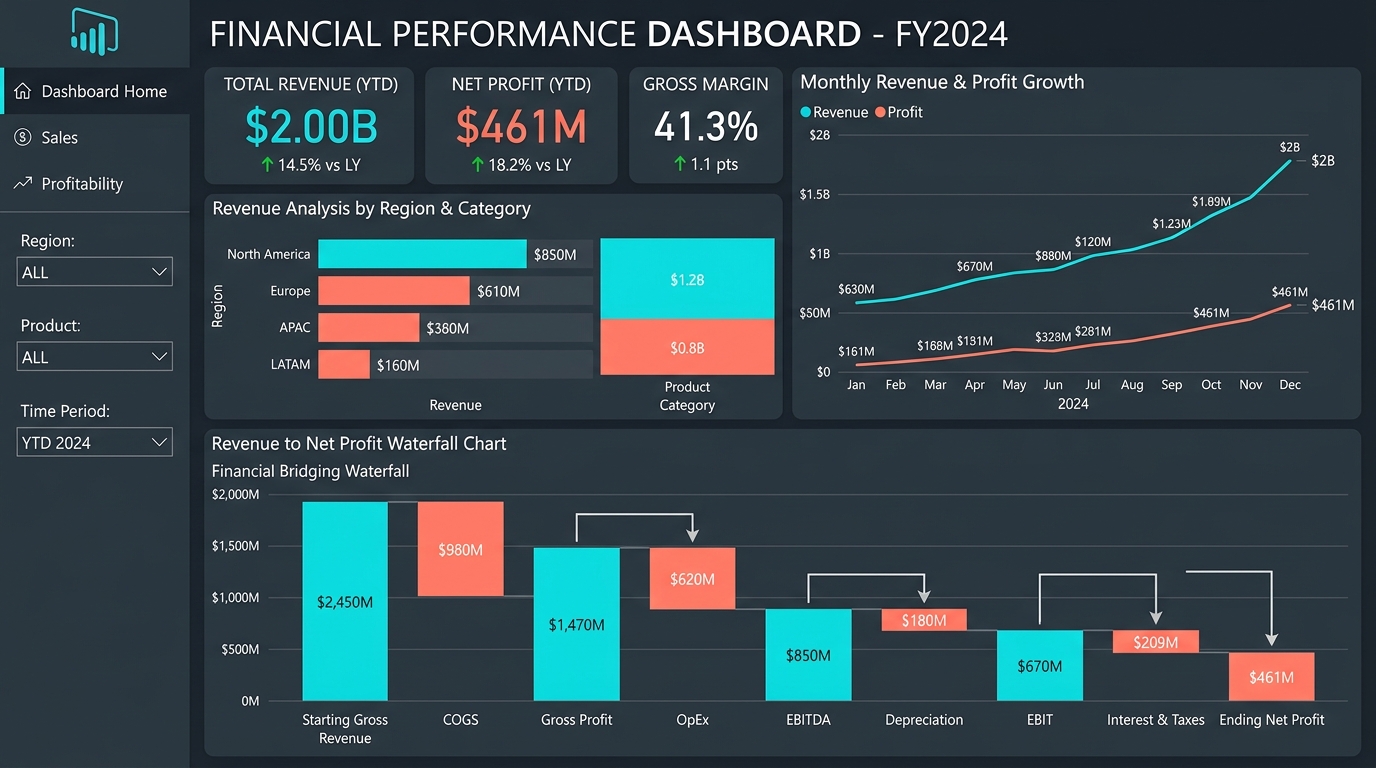
“Engineered an enterprise Power BI business intelligence dashboard tracking $2.00B in revenue and $461M net margin across multi-tier regional and product dimensions.”
My Challenge
Enterprise leadership faced fragmented visibility into regional revenue performance, cost-of-goods-sold (COGS) variance, and profit leakage across multi-product portfolios. Decision-makers lacked real-time visibility into sales pipeline conversion funnels, seasonal profit velocity, and waterfall margin bridging, hindering strategic capital allocation and quarterly forecasting.
My Solution
Designed and developed an end-to-end Power BI financial and sales performance dashboard powered by an optimized star-schema data model. Formulated advanced DAX measures for Year-to-Date (YTD) revenue growth, EBITDA margin, and operational expense bridging. Built intuitive interactive visualizations—including 100% stacked monthly sales contribution bars, multi-tier regional drill-downs, conversion funnels, and dynamic profit waterfalls with instant cross-filtering.
Results & Achievements
- Centralized $2.00B in enterprise sales transactions and $461M in net profit margins into a unified intelligence command center.
- Built dynamic financial waterfall charts isolating COGS, OpEx, and EBITDA bridging across FY2024 performance quarters.
- Reduced quarterly financial reporting turnaround time by over 70% with automated data refresh and cross-filtering.
- Integrated sales conversion funnel tracking 480+ pipeline opportunities to pinpoint stage drop-offs.
- Empowered executive leadership with interactive scenario planning, region-level comparisons, and margin drill-downs.
Skills Utilized
Let's Create Something Great
Data Science Trainer
© 2026 Priyanshu Pal. All rights reserved.