EV Charging Infrastructure & Peak Demand Analysis
“Exploratory Data Analysis (EDA) and peak utilization modeling on 1.33M+ EV charging sessions across 8 major networks including Tesla Supercharger, Electrify America & ChargePoint.”
My Challenge
Rapid electric vehicle adoption has placed extreme strain on charging station networks, leading to severe peak-hour congestion, unpredictable wait times, port outages, and grid load volatility. Station operators and city planners needed deep statistical intelligence across more than 1.33 million real-world charging records to understand station density distribution, identify peak vs. non-peak dynamics, and model feature skewness across key operational variables.
My Solution
Spearheaded end-to-end Exploratory Data Analysis (EDA) and feature distribution analysis on 1,330,000+ charging session records spanning 8 premier charging networks: Electrify America, Volta, Shell Recharge, Blink, Tesla Supercharger, ChargePoint, EVCS, and EVgo. Engineered peak-hour classification metrics, isolated power output profiles, evaluated station utilization and port downtime patterns, and analyzed parametric skewness across 18 operational variables (wait times, pricing, ambient temperature, traffic congestion, and port availability) using Python, Pandas, Matplotlib, and Seaborn.
Results & Achievements
- Cleaned, engineered, and evaluated a massive dataset of 1,330,000+ EV charging transactions across 8 national networks.
- Quantified peak-demand disparity (~390,000 peak sessions vs. ~940,000 standard sessions), laying the groundwork for time-of-use pricing and demand response.
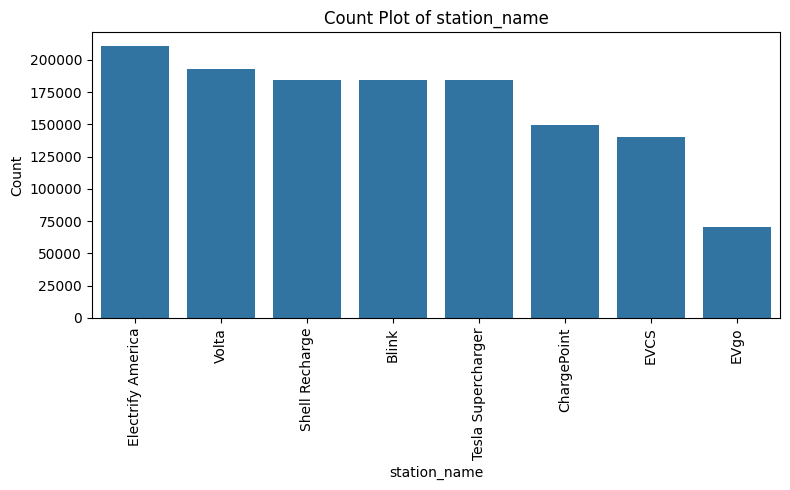
- Benchmarked charging network footprint, revealing Electrify America (210k+ sessions) and Volta (193k+ sessions) as the highest volume operators.
- Conducted rigorous skewness and distribution analysis across 18 variables—uncovering heavy right-skewed wait times (skewness: 6.84) and port outage spikes (skewness: 4.57).
- Delivered data-backed recommendations on dynamic pricing, grid load balancing, and targeted station expansion to minimize driver wait times.
Skills Utilized
Let's Create Something Great
Data Science Trainer
© 2026 Priyanshu Pal. All rights reserved.